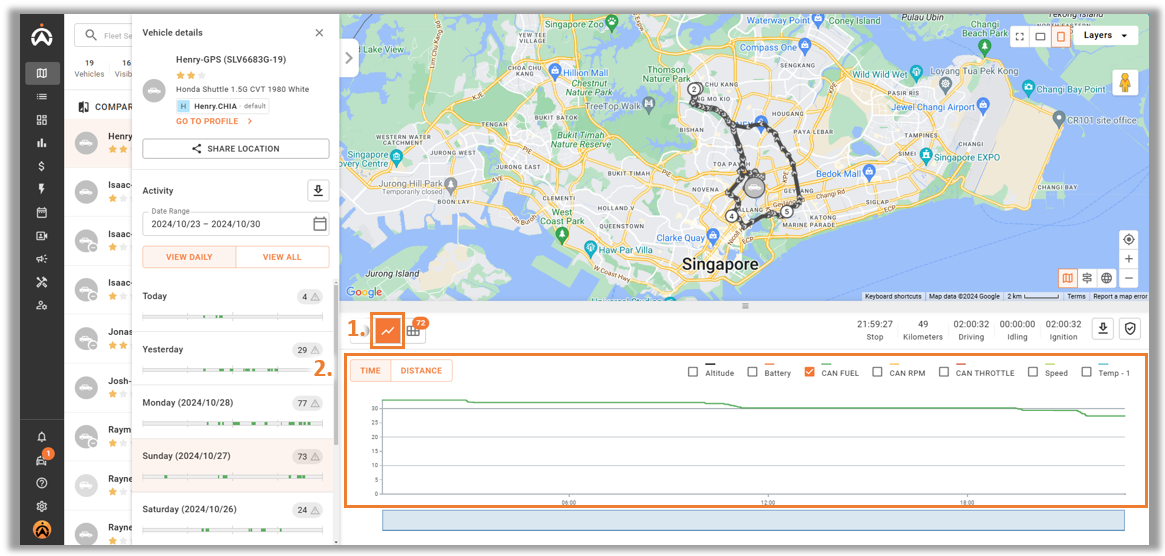
The Graph tab displays most Add-on Sensors such as Fuel, Temperature, Panic Button and CAN data.
1. Click on the “![]() ” icon.
” icon.
2. Select single or multiple sensor categories to be displayed on the graph based on Time or Distance.
The Graph tab displays most Add-on Sensors such as Fuel, Temperature, Panic Button and CAN data.
1. Click on the “![]() ” icon.
” icon.
2. Select single or multiple sensor categories to be displayed on the graph based on Time or Distance.


